What is the Program?

The Power of One turns statistics about HIV in Canada into an interactive exhibit with an art-gallery feel, allowing people to visually experience the scope of HIV’s impact. In the exhibit, each fact is visually represented with a pile of rice—each grain of rice represents one person. The exhibit is tailored as much as possible to present statistics relevant to the audience to whom it is being shown—statistics that are relevant to a group of teenage students will differ from those that are relevant to a group of HIV conference attendees. It works particularly well in university and school settings, at AIDS service organizations (ASOs), at conferences and almost anywhere that HIV outreach is required. The exhibit is inexpensive and highly adaptable. It can be mounted in a hallway to catch passersby or in a gymnasium in the style of an art exhibition. It can be on display for hours or months. At the core of the exhibit, regardless of its size or duration, is the selection of key statistics on HIV and more general statistics of relevance to the target audience where the exhibit is being held.
Why Was the Program Developed?
The impact of HIV can be difficult to grasp and can even intimidate some people, yet statistics represent a significant part of any attempt to measure and understand the virus’ impact. In designing HIV prevention programs, for example, it is important to know the incidence of HIV to know where the epidemic is heading. In providing HIV care, treatment and support, meanwhile, it is important to know the prevalence of HIV to understand who is in need of services as well as what types of services and how many. Finding a way to understand and present HIV numbers in an interesting and meaningful way has been an ongoing challenge for HIV/AIDS educators since the start of the epidemic.
The Power of One was inspired by the “Of All The People In All The World” exhibits mounted around the world by the UK-based theatre company Stan’s Café. These exhibits use grains of rice to represent the populations of towns, cities, nations and continents, as well as the number of people born each day, the number of people who die each day, the number of deaths in the Holocaust and much more.
As Stan’s Café describes its own project, “The exhibit uses grains of rice to bring formally abstract statistics to startling and powerful life.” At an exhibition in a stadium in Stuttgart, Germany, Stan’s Café used 104 tons of rice to represent the population of the entire world.
Taking the concept of using rice to illustrate statistics and the premise that one grain of rice equals one person, CATIE began counting and weighing rice to create a visual picture of HIV in Canada in November 2009 at the Ontario HIV Treatment Network Research Conference. The strong interest in this presentation combined with positive feedback encouraged CATIE to offer it in other settings.
How Does the Program Work?
Location
This exhibit has been mounted in hallways, small banquet rooms, large public spaces and boardrooms. The design of the exhibit is very open to interpretation and space restrictions. There need only be enough room to make it visually impactful. Piles of rice representing different statistics can be placed on sheets of brightly coloured or white paper. They can be arranged on tables or even the floor.
Recruitment and Engagement
Anyone can put the exhibit together, and the exhibit can be mounted almost anywhere. Having toured the exhibit around Canada—stopping in Vancouver, Saskatoon, Montreal and Fredericton—CATIE finds it works very well with all types of audiences, particularly those with a limited knowledge of HIV.
An exhibit can last for hours or months depending on the location and audience. CATIE has mounted a small version of the exhibit in the hallway at a university for three hours and a larger version in a boardroom during an HIV conference for three full days. In such cases, the proximity of the exhibits to other events/activities was sufficient to attract an audience without any added advertising. The simplicity and ease of mounting a Power of One exhibit makes it impactful simply by its presence.
The exhibit does not necessarily require promotion, as it can “piggy back” on other events happening on a campus or at a conference or institution. However, if promotional materials are used to attract an audience, it is important to note that because the concept of the project is highly visual, it doesn’t easily translate to the written word. Consequently, promotional materials should rely heavily on creative visuals (such as photos of different piles of rice and people interacting with them) to attract audiences rather than on citing the very numbers the exhibit tries to steer audiences away from. An example of CATIE’s promotional poster for the Power of One exhibit is available in Program Materials.
With enough space, resources and marketing dedicated to the project, an even larger version of the exhibit could run for a more extended period of time to draw a larger audience in the style of the “Of All The People In All The World” exhibits.
Training
No formal training is required in order for an individual or organization to create a Power of One exhibit.
Setting Up the Exhibit
Exhibit Space and Audience
Preparing a Power of One exhibit begins by anticipating the target audience for the exhibit and identifying the space where the exhibit will be held. This is important for gathering relevant statistics, as statistics that are relevant to a group of teenage students will differ from those that are relevant to a group of HIV conference attendees. Furthermore, if space is constrained, there may be a limitation to the number and scope of statistics that can be selected.
Statistics
Gathering statistics is the single most important step in preparing an impactful exhibit. There are two types of statistics that must be gathered:
- HIV statistics
- General statistics to provide context
A good starting point for national and provincial HIV statistics is the HIV/AIDS Surveillance Report released twice a year by the Public Health Agency of Canada (PHAC). For HIV estimates, PHAC’s national HIV/AIDS Epi Update is released every three years. See links to these documents in the Other Useful Resources section for more information.
In gathering HIV statistics, CATIE tends to start with some key national statistics, as these are relevant to all audiences and serve as a solid base for more specific statistics. Similar data with a more localized focus can then be pulled from the provincial statistics.
Examples of HIV statistics are:
- People estimated to be living with HIV in Canada
- People diagnosed with HIV during immigration screenings
- Number of youth (aged 15-29) diagnosed with HIV in Canada
Examples of specific regional statistics (where available):
- People living with HIV in the province where the exhibit will be displayed
- Number of people working at AIDS service organizations in the region
- Number of names on a local AIDS memorial
For an overview of the Epidemiology of HIV in Canada, including key definitions of epidemiological terms, see the Other Useful Resources section.
Next, these HIV statistics must be put into a context that is immediately relevant to the exhibit’s anticipated audience. If 40,000 people fit into a local concert hall and there are an estimated 65,000 people living with HIV in Canada, for example, the two piles of rice made to illustrate these numbers will give audiences an instant picture of the scope of the epidemic in terms immediately relevant to their local experience.
Examples of general statistics to provide context:
- The number of people who can be seated in a local concert hall
- The number of students attending a local high school or university
- The number of passengers who ride a particular train route daily
- People diagnosed with heart disease each year in the region
General local statistics can be found at local libraries and in local newspapers or by contacting local health officials, researchers and local organizations such as schools, food banks and community centres in the city or region where the exhibit will be mounted.
When choosing statistics, make sure they are:
- Numbers of people
- Appropriate
- Realistic
The single most important consideration when selecting statistics is to be sure that they are numbers of people, not numbers of days, cars or anything else. While it may be interesting to know the number of pounds of coffee consumed by the average person in a year or the number of cars on an expressway on a busy weekend, these are not numbers of people and cannot, therefore, be illustrated using the formula for the Power of One exhibit in which one grain of rice equals one person.
Statistics should also be chosen with a certain reverence for the context in which they will be displayed. Overtly whimsical or silly statistics (for example, the number of people who have a pet hamster) should be avoided so as not to trivialize the exhibit’s main subject.
It is also important to be realistic, as larger numbers require more rice. So while it may be interesting to show the number of people living with HIV in the world, dealing with such a large number requires a more complex plan than the Power of One exhibits have employed to date. To purchase, store, exhibit and recycle or donate more than 33 million grains of rice requires an elaborate plan and a great deal of organized support.
The beauty of Power of One is that it can be easily presented without a great deal of support and planning simply by sticking to numbers that can be effectively illustrated with a smaller budget and staff.
Building the Piles of Rice
To avoid having to count each grain of rice, the statistics are converted to grains of rice with the following formula:
- Count out 500 grains of rice.
- Weigh the 500 grains of rice.
- Divide the weight by 500 to get the weight of 1 grain of rice.
- Take statistic and multiply it by the weight of 1 grain of rice.
For example, if one grain of rice weighs .025 grams, then:
65,000 people living with HIV in Canada x .025 = 1,625 grams of rice
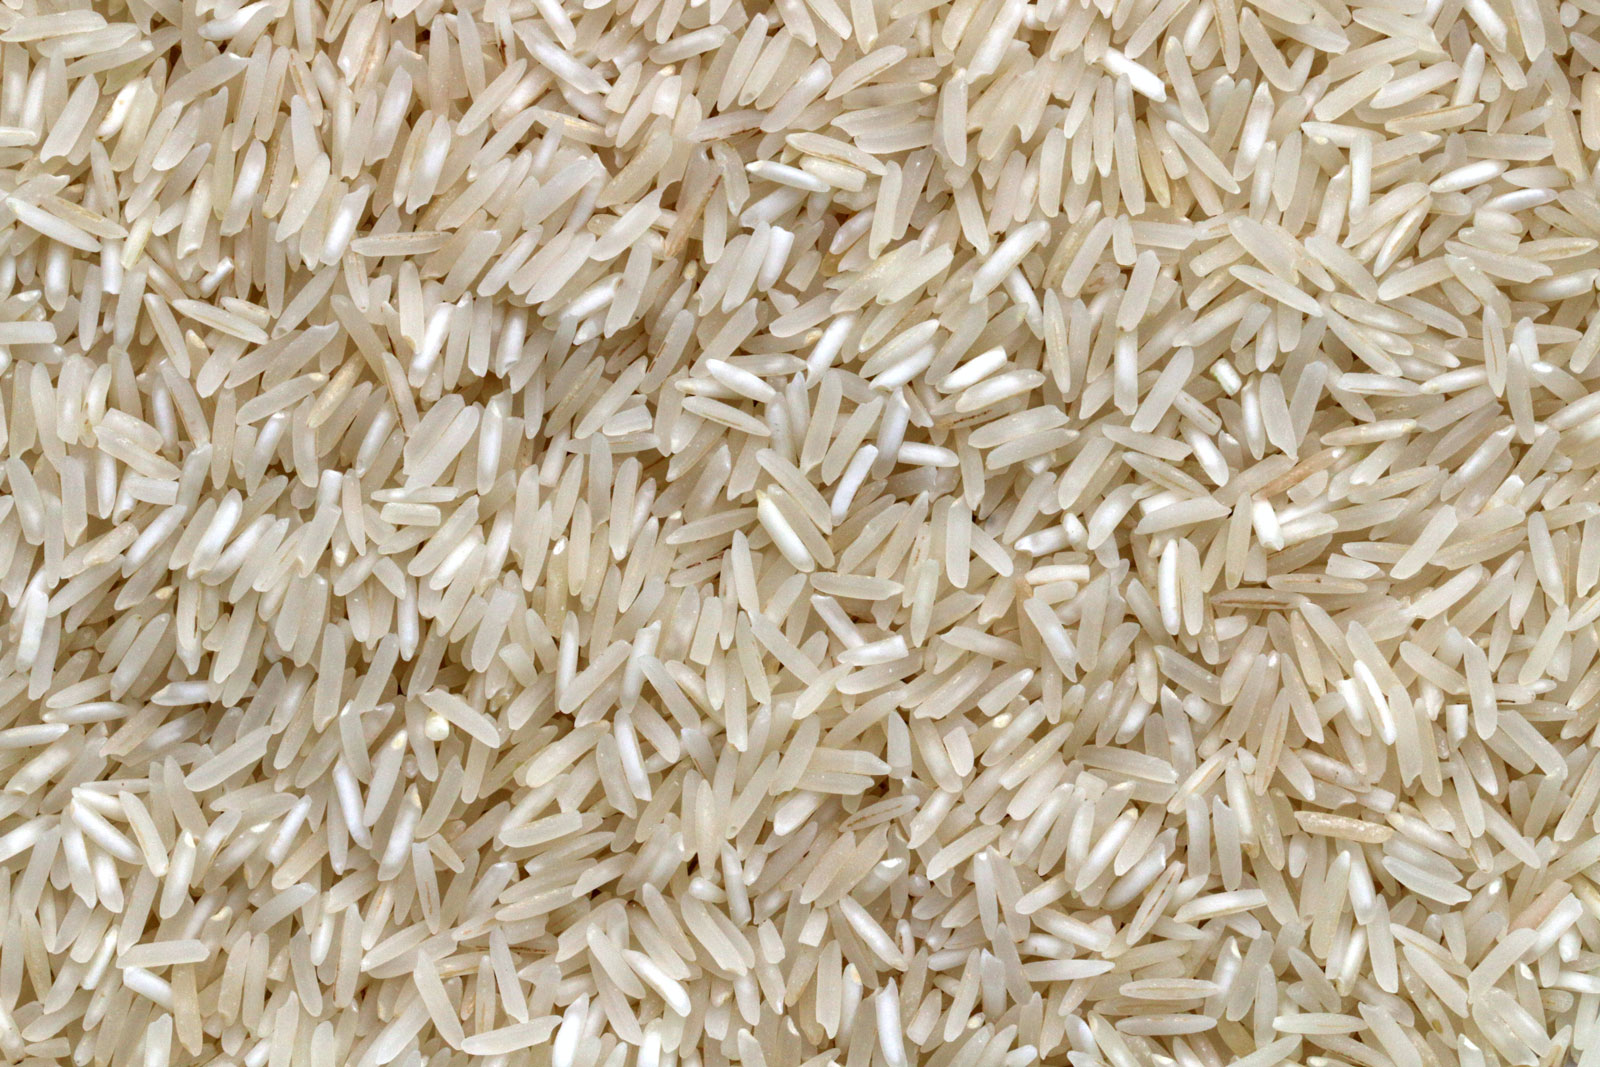
Any type of rice may be used in the exhibition, though white long-grain rice is usually the least expensive. Using a baking scale, the rice is weighed then placed on a sheet of paper with an accompanying “name tag” to identify the pile of rice (“People living with HIV in Canada”). When creating piles of rice for numbers that are smaller than 200, rice should be counted out.
To display each statistic, CATIE has used sheets of red art paper of consistent size and texture to allow the white rice and white name tags to stand out clearly against them and to match the colour scheme of the organization’s logo. Stan’s Café uses white paper of different sizes in its “Of All The People In All The World” exhibits, and other groups have used multi-coloured paper. The presentation is entirely at the discretion of the presenter.
Once the paper is chosen and the rice is weighed, the statistics are arranged together in the exhibit space. Their juxtapositions can be moving, shocking, celebratory, witty and/or thought provoking. CATIE finds that starting with one grain of rice on one sheet of paper with the tag “You” and working up in ever larger piles to the very largest pile (usually “People living with HIV in Canada”) is the most effective way of letting the statistics speak for themselves without putting any specific value on any one pile.
It is also possible to deliberately juxtapose different statistics to suggest certain conclusions. However, this should be done only after giving serious consideration to the purpose of the exhibit, which is to allow people to draw their own conclusions after seeing statistics brought into a different perspective.
Similarly, CATIE has avoided writing the actual numbers represented on tags, as the exhibit is designed to move away from seeing statistics in numbers and toward seeing them in visual, physical terms. However, some groups who have created a Power of One exhibit under CATIE’s guidance have chosen to include numbers on the back of the tags for those who wish to “peek” at the numbers.
Exhibition
During the time that the Power of One exhibit is open to the public, people should be allowed to interact with the piles of rice as they choose for maximum engagement. CATIE has found that some people like to touch and count the rice. Still others have formed the rice into shapes, such as an AIDS ribbon to express solidarity or a needle for those who became infected through injection drug use (however, disparate shapes of the piles of rice can make the visual contrast between piles more difficult to discern).
“One of the piles at a workshop was labeled ‘Estimated number of people who’ve died of HIV/AIDS infection to 2008 in Canada.’ I had one guy come up to me with tears in his eyes, holding one grain of rice and saying, ‘I know that my friend isn’t in this pile. Can I add him?’ This is powerful for people.” - Melissa Egan, Educator and Power of One project coordinator, CATIE
Though the exhibit does not require a guide or facilitator, it is recommended that a person with sufficient knowledge of HIV be present near the end of the exhibit to answer questions, provide literature on HIV and encourage an appropriate amount of interaction with the exhibit while dissuading anyone from any disruptive or frivolous interaction (such as removing or displacing the rice).
In addition to HIV 101 literature, CATIE brings copies of a four-page epidemiological fact sheet for distribution at each exhibit. Copies of more detailed reports from PHAC on national and population-specific surveillance reporting are also available for perusal for anyone interested in a more in-depth look at HIV statistics. Please see the Other Useful Resources section for these and other documents.
Breaking Down the Exhibit
The rice used for the Power of One exhibit can be swept from each sheet of coloured paper into a plastic baggie labeled with the statistic it represents to be reused the next time the exhibit is mounted. It is helpful to have a tiny dustpan and brush to facilitate the collection of rice into the baggies as well as a suitcase for transporting them.
In the event that the exhibit is not expected to be remounted or should travel considerations make the transportation of rice impractical, the rice can often be given to a local community organization at the conclusion of the exhibit to be used as food.
Required Resources
Human resources
Anyone can put the exhibit together provided he or she is familiar with basic information on HIV statistics and their relevance to the target audience.
Material resources
- Rice (8 kilograms for a small exhibit)
- Sheets of coloured paper (20 sheets for a small exhibit)
- Tags with statistics expressed in human terms
- Baking scale
- Small dustpan and brush
- Plastic baggies
- Suitcase
Financial resources
The cost of the exhibit depends largely on the number and size of statistics that will be on display. Eight kilograms of white long-grain rice costs less than $15 and is sufficient for a small exhibit. Art-store-quality paper costs about $1 per sheet, and 20 sheets are sufficient for a small exhibit. A reasonably sensitive baking scale costs about $60. So, a small exhibit that requires no transportation will cost less than $100. Literature on HIV/AIDS for distribution at the exhibit is available for free from CATIE’s Ordering Centre and can be located through the Other Useful Resources section of this case study.
Depending on where the exhibit is mounted, a marketing budget for flyers, advertisements, a press release, etc., may also be added to ensure that the exhibition is well attended.
Challenges
There are no major barriers to mounting a Power of One exhibit. However, the following minor challenges should be accounted for to allow sufficient planning time.
- Local and regional HIV statistics are not always available.
- Finding statistics that are expressed in numbers of people as opposed to numbers of kilometres, days, dollars, etc., may require resourcefulness and creativity.
- Depicting statistics with large numbers requires large quantities of rice, which can be difficult to purchase, transport, store, exhibit and dispose of.
Evaluation
To collect audience feedback on the Power of One, four bowls are placed near the end of the exhibit: a large bowl full of rice bearing the phrase “This exhibit has helped me understand the impact of HIV in Canada” and three smaller empty bowls bearing the tags “agree,” “neither agree nor disagree” and “disagree.” Each audience member may take a grain of rice from the large bowl and put it into the bowl that best represents his or her answer to the question. At the conclusion of the exhibit, the grains of rice in each bowl can be counted.
Numbers from past exhibit evaluations:
- Agree: 362 (86%)
- Neither agree nor disagree: 54 (13%)
- Disagree: 6 (1%)
It is recommended that an attendant be stationed near the evaluation portion of the exhibit to answer questions as people exit and to invite them to leave comments in the accompanying comment book.
Testimonials from audience members:
- Thank you for letting me hold the truth in my hands.
- Seeing these mountains of rice made me feel like I wasn’t alone.
- We don’t have an appreciation of numbers that we can’t count on two hands. This really drives the point home.
- Puts things in perspective…better than a Power Point!
- Should be mandatory viewing by all MDs.
- Excellent visual of HIV/AIDS, STIs and the experience of hunger around the globe.
Lessons Learned
- Transforming statistics into physical piles of rice can make them more accessible, particularly to those who are confused, overwhelmed or intimidated by numbers.
- Keeping an interactive, participatory atmosphere in an exhibition and situating the exhibition in an accessible setting can improve audience engagement.
- Finding compelling non-HIV statistics with which to compare HIV statistics can serve as important points of reference and comparison, especially for audiences with limited awareness of HIV.
- Focusing on statistics that can be easily illustrated with small piles of rice keeps the exhibit costs and staffing needs to a minimum.
- ASOs and other organizations can effectively draw attention to specific HIV-related issues by displaying important statistics in a context that is relevant to their target audience.
Program Materials
Contact Information
For more information on the project, please contact:
Melissa Egan
Canadian AIDS Treatment Information Exchange (CATIE)
555 Richmond Street West, Suite 505
Toronto ON M5V 3B1
(416) 203-7122, ext. 330
megan@catie.ca
www.catie.ca